Current Affairs (1st June 2021)
India’s GDP fall
Context:
- Recently, the Indian government released its latest estimates of economic growth for the last financial year that ended in March 2021. India’s Gross Domestic Product (GDP) contracted by 7.3% in 2020-21.
- Between the early 1990s until the pandemic hit the country, India grew at an average of around 7% every year.
Two ways to view this contraction in GDP:
- India is facing a once-in-a-century COVID-19 pandemic. The other way would be to look at this contraction in the context of what has been happening to the Indian economy over the last decade — and more precisely over the last seven years.
- Seen in this context, the latest GDP data suggests that it is not an outlier. Instead, if one looked at some of the most important variables in the data, India’s economy had been steadily worsening during the current regime even before the Covid-19 pandemic.
- Fundamentals of the economy refers to a bunch of economy-wide variables that provide the most robust measure of an economy’s health.
- During periods of economic upheaval, political leaders reassure the public that the “fundamentals of the economy are sound”.
Gross Domestic Product
- GDP growth rate has been a point of growing weakness for the last 5 of these 7 years.
- According to the Reserve Bank of India or RBI’s Annual Report for FY21, the following chart maps the turning points in India’s growth story.
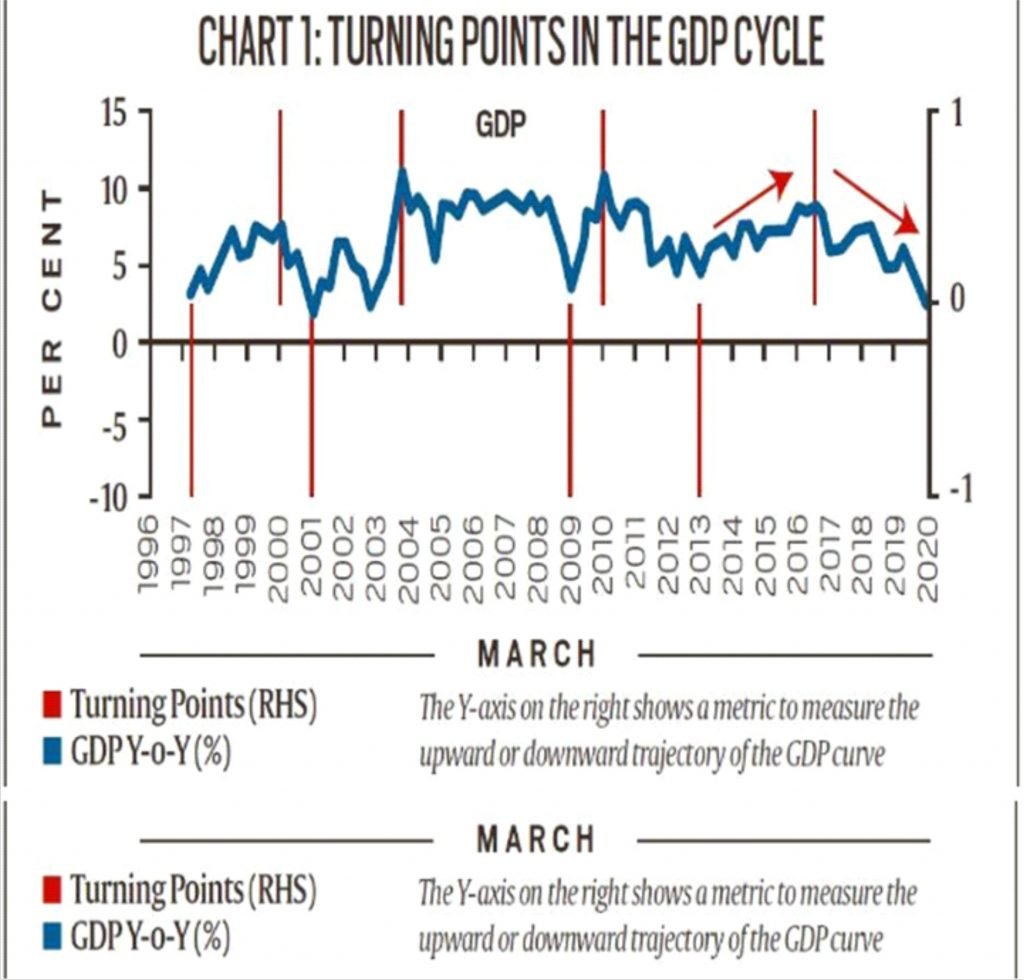
- After the decline in the wake of the Global Financial Crisis, the Indian economy started its recovery in March 2013 — more than a year before the present government took charge.
- But more importantly, this recovery turned into a secular deceleration of growth since the third quarter (October to December) of 2016-17.
- While RBI does not state it, the government’s decision to demonetise 86% of India’s currency overnight in 2016 is seen by many experts as the trigger that set India’s growth into a downward spiral.
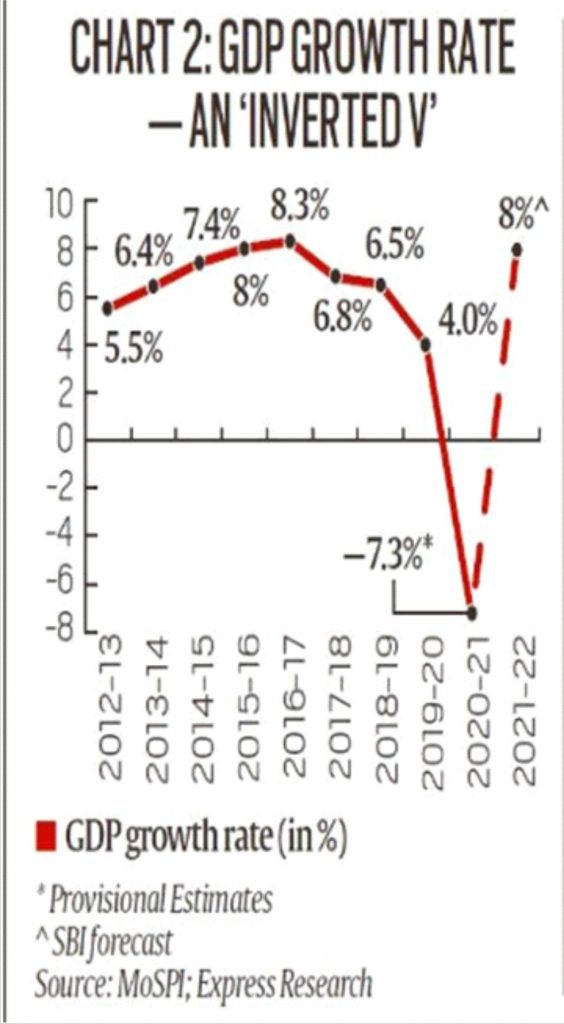
- As the ripples of demonetisation and a poorly designed and hastily implemented Goods and Services Tax (GST) spread through an economy that was already struggling with massive bad loans in the banking system, the GDP growth rate steadily fell from over 8% in FY17 to about 4% in FY20, just before Covid-19 hit the country.
- In January 2020, as the GDP growth fell to a 42-year low (in terms of nominal GDP), PM expressed optimism, stating: “The strong absorbent capacity of the Indian economy shows the strength of basic fundamentals of the Indian economy and its capacity to bounce back”.
- As an analysis of key variables suggests, the fundamentals of the Indian economy were already quite weak even in January last year — well before the pandemic.
- For example, if one looks at the recent past (Chart 2), India’s GDP growth pattern resembled an “inverted V” even before Covid-19 hit the economy.
GDP per capita
- GDP per capita is total GDP divided by the total population.
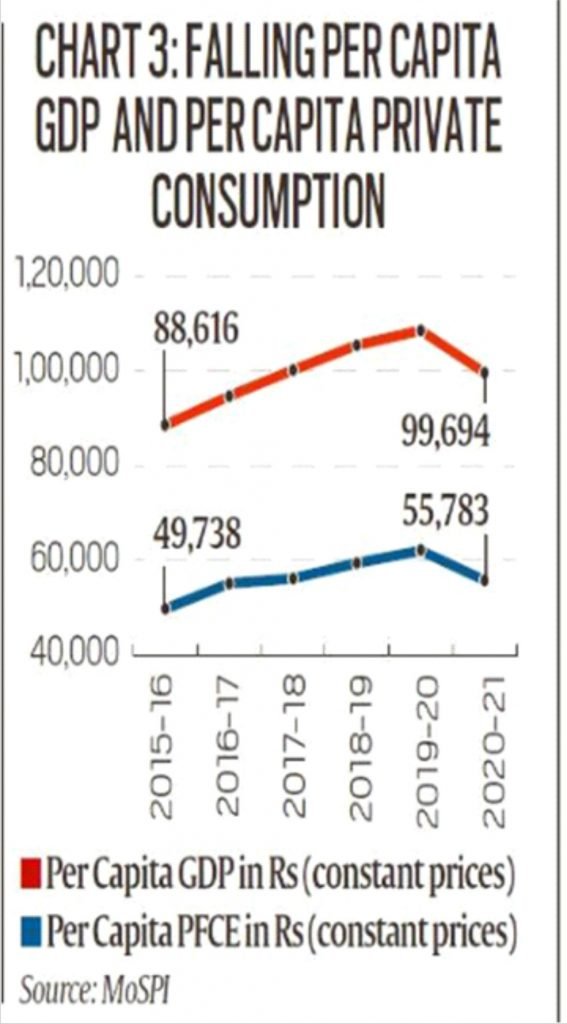
- Red curve in Chart 3 shows at a level of Rs 99,700, India’s GDP per capita is now what it used to be in 2016-17 — the year when the slide started.
- As a result, India has been losing out to other countries. A case in point is how even Bangladesh has overtaken India in per-capita-GDP terms.
Unemployment rate
- India’s unemployment rate, according to the government’s own surveys, was at a 45-year high in 2017-18 — the year after demonetisation and the one that saw the introduction of GST.
- Between 2012 and 2018, the total number of employed people fell by 9 million — the first such instance of total employment declining in independent India’s history.
- As against the norm of an unemployment rate of 2%-3%, India started routinely witnessing unemployment rates close to 6%-7% in the years leading up to Covid-19. The pandemic, of course, made matters considerably worse.
- This is happening even when the labour force participation rate — which maps the proportion of people who even look for a job — has been falling.
- With weak growth prospects, unemployment is likely to be the biggest headache for the government in the remainder of its current term.
Inflation rate
- In the first three years, the sudden and sharp fall in oil prices allowed the government to completely tame the high retail inflation in the country, while on the other, it allowed the government to collect additional taxes on fuel.
- But since the last quarter of 2019, India has been facing persistently high retail inflation. Even the demand destruction due to lockdowns induced by Covid-19 in 2020 could not extinguish the inflationary surge.
- India was one of few countries — among comparable advanced and emerging market economies — that has witnessed inflation trending consistently above or near the RBI’s threshold since late 2019.
- Going forward, inflation is a big worry for India. It is for this reason that the RBI is expected to avoid cutting interest rates (despite faltering growth) in its upcoming credit policy review on June 4.
Fiscal deficit
- The fiscal deficit is essentially a marker of the health of government finances and tracks the amount of money that a government has to borrow from the market to meet its expenses.
- There are two downsides of excessive borrowing. One, government borrowings reduce the investible funds available for the private businesses to borrow (this is called “crowding out the private sector”); this also drives up the price (that is, the interest rate) for such loans.
- Two, additional borrowings increase the overall debt that the government has to repay. Higher debt levels imply a higher proportion of government taxes going to pay back past loans. For the same reason, higher levels of debt also imply a higher level of taxes.
- On paper, India’s fiscal deficit levels were just a tad more than the norms set, but even before Covid-19, the fiscal deficit was far more than what the government publicly stated.
- In the Union Budget for the current financial year, the government conceded that it had been underreporting the fiscal deficit by almost 2% of India’s GDP.
Rupee vs dollar
- A US dollar was worth Rs 59 when the government took charge in 2014. Seven years later, it is closer to Rs 73. The relative weakness of the rupee reflects the reduced purchasing power of the Indian currency.
- These were some, not all, of the metrics that often qualify as the fundamentals of an economy.
What’s the outlook on growth?
- The biggest engine for growth in India is the expenditure by common people in their private capacity. This “demand” for goods accounts for 55% of all GDP.
- In Chart 3, the blue curve shows the per capita level of this private consumption expenditure, which has fallen to levels last seen in 2016-17.
- This means if the government does not help, India’s GDP may not revert to the pre-Covid trajectory for several years to come. It is for this reason that the latest GDP should not be viewed as an outlier.
Pesticides cause of poisoning
Context:
- The prevalence of pesticide poisoning in the adult population was 65 per cent and 22 per cent in children, according to the study published in the British Medical Journal (BMJ). It was titled Toxicoepidemiology of poisoning exhibited in Indian population from 2010 to 2020: A systematic review and meta-analysis.
About:
- Pesticides are the leading cause of poisoning in India, with two in every three cases of poisoning happening because of pesticide consumption either intentionally or unintentionally.
- The research involved analysing 134 research studies done between January 2010 and May 2020, including more than 50,000 participants.
- It revealed that pesticides were the main case of poisoning, with an overall prevalence of 63 percent due to widespread use of pesticides for agricultural and household activities.
- Other types of poisoning included corrosives, venoms, drugs and miscellaneous agents. The second most common cause of poisoning was miscellaneous agents, followed by drugs, venoms and corrosives.
- An analysis of the region-wide distribution of the prevalence of poisoning showed that it was the highest in north India at 79 per cent (more than three-fourths of the total cases of poisoning), followed by south India (65.9 per cent), central India (59.2 per cent), west India (53.1 per cent), north east India (46.9 per cent) and east India (38.5 per cent).
- The reasons for pesticide poisoning were the co-existence of poverty and agricultural farming and thus, the easy availability of pesticides.
- The research has once again brought to fore the issues regarding the unabated use of pesticides in India and how they continue to be a great threat to human health.
- Thousands of farmers and farm labourers die every year due to unsafe use of hazardous pesticides.
- Deaths of farmers and the public across Maharashtra, Kerala, Punjab, Karnataka, and Bihar among other states in the last few years due to pesticide consumption have highlighted the need to regulate their use.
- Easy access to pesticides has also led its consumption becoming the leading cause of suicides worldwide.
- The World Health Organization and its member countries initiated a programme of safe access of pesticides, which has resulted in a decrease in the prevalence of fatal poisoning by 10 per cent across the world.
- However, pesticides remain the leading cause of poisoning in south Asian countries including India and in south east Asia and China.
- The strict restriction of highly lethal pesticides by legal mechanisms or policy actions drastically reduced deaths.