Inequality Report
The Indian Express
GS 2: Issues relating to development and management of Social Sector/Services relating to Health, Education, Human Resources.
Context:
- World Inequality Report is recently released which is authored by Lucas Chancel, co-director of the World Inequality Lab, and coordinated by several experts, including French economist Thomas Piketty.
Highlights:
- The report flagged a drop in global income during 2020, with about half of the dip in rich countries and the rest in low-income and emerging regions. This is attributed primarily due to the impact of “South and Southeast Asia, and more precisely” India.
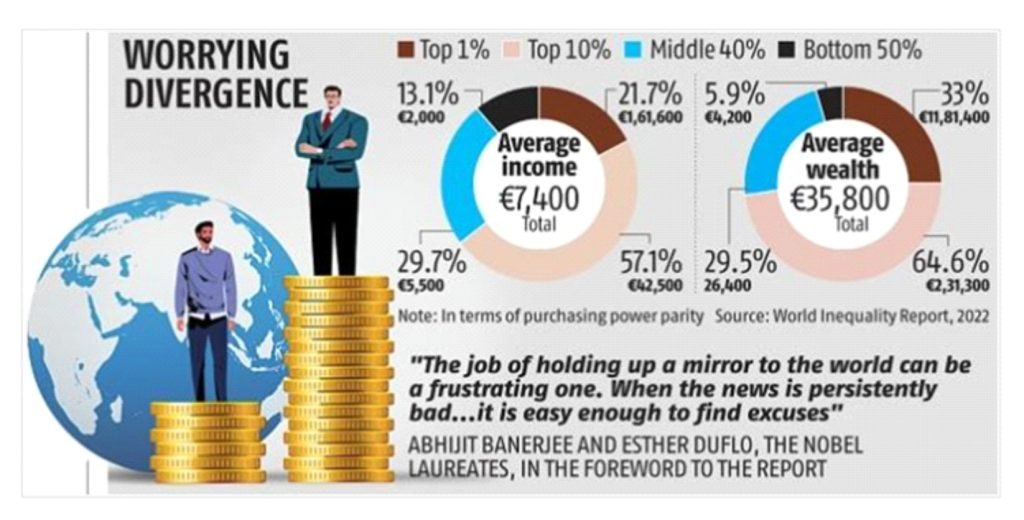
- India stands out as a “poor and very unequal country, with an affluent elite”, where the top 10% holds 57% of the total national income while the bottom 50 per cent’s share is just 13% in 2021.
- India’s middle class is relatively poor with an average wealth of only Rs 7,23,930 or 29.5% of the total national income, as compared with the top 10% and 1% who own 65% (Rs 63,54,070) and 33% (Rs 3,24,49,360), respectively.
- The average annual national income of the Indian adult population is Rs 2,04,200 in 2021. The bottom 50% earned Rs 53,610, while the top 10% earned over 20 times more (Rs 11,66,520).
- The average household wealth in India is Rs 9,83,010, with the bottom 50% owning almost nothing, with an average wealth of 6% of the total Rs 66,280.
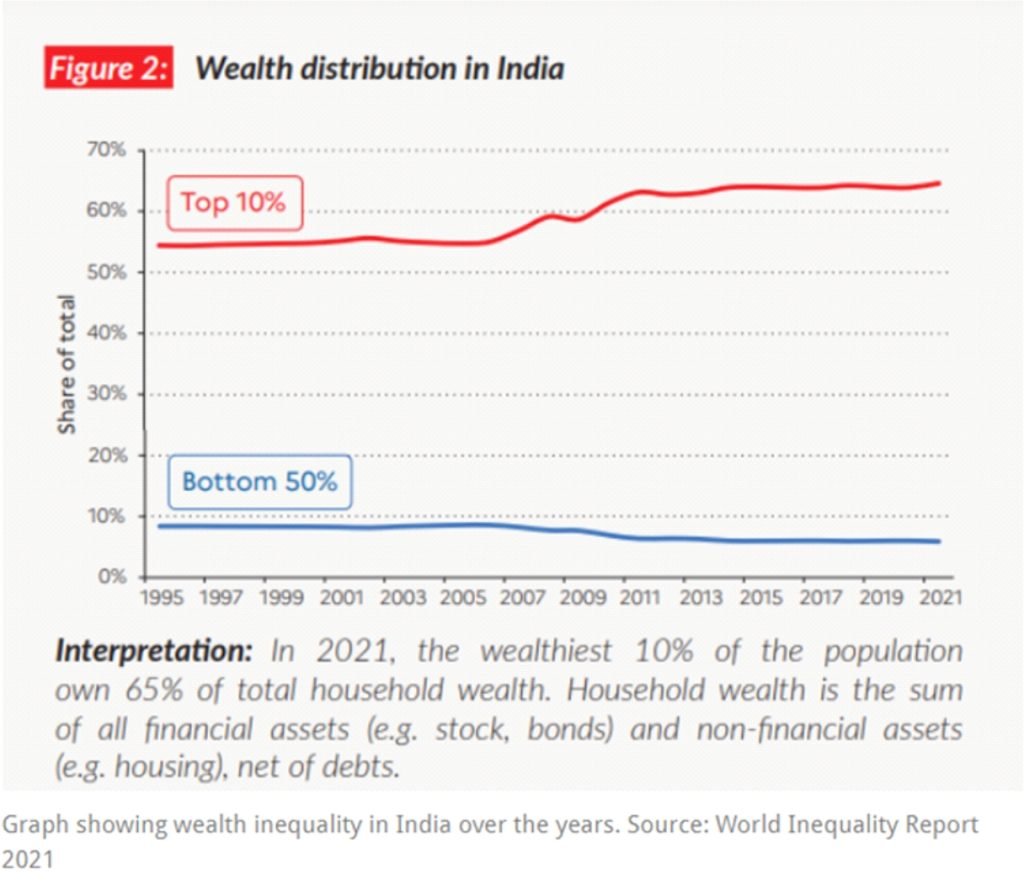
- The share of top 10% and bottom 50% in pre-tax national income has remained broadly constant from 2014 onwards.
- The top one per cent of the population in India owns more than one-fifth of the total national income in 2021 while the bottom half earns just 13.1 per cent.
- For India, the quality of inequality data released by the Government has seriously deteriorated, making it particularly difficult to assess recent inequality changes, the report states.
- As per the recent Multi-dimensional Poverty Index (MPI) prepared by NITI Aayog, one in every four people in India was multidimensionally poor. Bihar has the highest proportion of people (51.91% of the state’s population) who are multidimensionally poor, followed by Jharkhand at 42.16% and Uttar Pradesh at 37.79%.
- Global inequalities seem to be about as great today as they were at the peak of Western imperialism in the early 20th century. The poorest half of the global population “barely owns any wealth” possessing just 2% of the total, whereas the richest 10% of the global population own 76% of all wealth.
- The Middle East and North Africa (MENA) are the most unequal regions in the world, whereas Europe has the lowest inequality levels, the report says. In Europe, the top 10% income share is around 36%, whereas in MENA it is 58%. In East Asia, the top 10% makes 43% of total income and in Latin America the share is 55%.
- Even as countries have become richer over the last 40 years, their governments have become significantly poorer, a trend which has been magnified due to the pandemic.
- The share of wealth held by public actors is close to zero or negative in rich countries, meaning that the totality of wealth is in private hands.
- This trend has been magnified by the Covid crisis, during which governments borrowed the equivalent of 10-20% of GDP, essentially from the private sector.
- In 2021, there were 62.2 million people in the world owning more than $1 million (measured at market exchange rates). Their average wealth was $2.8 million, representing a total of $174 trillion and a global effective wealth tax rate of 1.2% could generate revenues of 2.1% of global income.
- On gender terms, women’s share of total incomes from work (labour income) was about 30% in 1990 and is less than 35% now.
- Inequalities within countries are now greater than those observed between countries. At the same time, the gap between the average incomes of the top 10% and the bottom 50% of individuals within countries has almost doubled.
- This sharp rise in within-country inequalities has meant that despite economic catch-up and strong growth in the emerging countries, the world remains particularly unequal today.
- Since the mid-1980s, deregulation and liberalisation policies have led to one of the most extreme increases in income and wealth inequality in the world.
- While the top 1% has largely benefited from economic reforms, growth among low and middle income groups has been relatively slow and poverty persists.
- When it comes to the BRICS nations, South Africa and Brazil have wider income inequalities than India.
Carbon inequality:
- India is a low carbon emitter. The average per capita consumption of greenhouse gas is equal to just over 2 CO2e. These levels are typically comparable with carbon footprints in sub-Saharan African countries.
- The bottom 50 per cent consume one, the middle 40 per cent 2 and the top ten per cent, 9 CO2e/capita.
- A person in the bottom 50 per cent of the population in India is responsible for, on average, five times fewer emissions than the average person in the bottom 50 per cent in the European Union and 10 times fewer than the average person in the bottom 50 per cent in the US.
Way ahead:
- The report has suggested levying a modest progressive wealth tax on multimillionaires. Given the large volume of wealth concentration, modest progressive taxes can generate significant revenues for governments. In our scenario, we find that 1.6% of global incomes could be generated and reinvested in education, health and the ecological transition.
Global Migration Trend in 2020
DTE
GS
Context:
- Recently, World Migration Report 2022 has been released.
Highlights:
- COVID-19 pandemic has radically altered the way we lead our lives, including international migration trends.
- The number of emigrants increased to 281 million in 2020 from 272 million in 2019.

- The increase, however, would have been higher by around 2 million if the pandemic had not struck.
- While it is known that the pandemic has placed huge restrictions on mobility, it is difficult to fully assess its impact on migration since the data collated for the study is only for the first year of the pandemic.
- The study also delves into other aspects of migration, including long-term trends on where people are migrating to and the impact of climate change on migration.
- Migration is shaped by economic, geographic, demographic and other factors, resulting in distinct migration patterns, such as migration ‘corridors’ developed over many years.
- In 2020, the largest number of migrants moved to United States, followed by Germany and Saudi Arabia. India topped the list of countries from where people migrated out, followed by Mexico and Russia.

- By the end of 2020, there were at least 26.4 million refugees globally.
- The highest number of refugees (8 million) moved from Syria — the fifth biggest source country.
- Afghanistan had the second-highest share of refugees spread across the world, followed by South Sudan, Myanmar and the Democratic Republic of Congo.
- Most of the displacement happened through the Mexico-US migration axis, followed by the Syrian Arab Republic-Turkey corridor.
- With over 3.5 million people, Turkey hosted the most number of refugees in 2020, followed by Pakistan, Uganda, Germany and Sudan.
- Around 4.1 million people sought asylum status in 2020. But first-instance asylum claims dropped 45% in the same year — around 1.1 million claims were made in 2020 compared to 2 million in 2019.
- Natural disasters and by extension climate change played a bigger role in shaping international migration patterns.
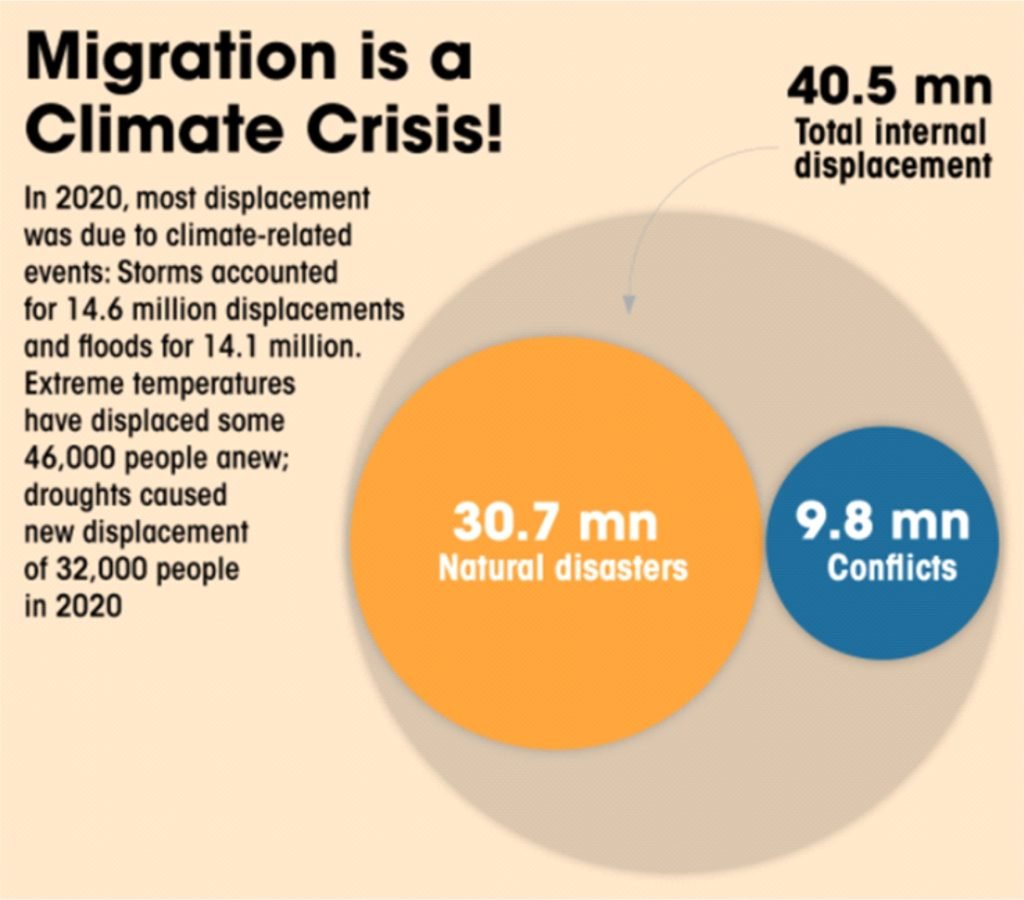
- In 2020, more people were displaced by disasters caused by climate change than conflicts, thereby reversing a historic trend.
- Total internal displacement due to disaster, conflict and violence increased in comparison to 2019, despite containment due to COVID-19 pandemic in 2020. The figure rose to 40.5 million in 2020 from 31.5 million in 2019.
- Most people moved out of their countries because of climate-related events — 14.6 million displacements were due to storms and 14.1 million due to floods.
- As many as 46,000 people were displaced due to extreme temperatures while some 32,000 moved out due to droughts in 2020.
- From 2008–2020, more than 2.4 million displacements were induced by droughts and over 1.1 million by extreme temperatures.