GDP growth surprise: How to read the data
Context- The Ministry of Statistics and Programme Implementation (MoSPI) threw up a massive surprise Thursday when it released the economic growth data for the second quarter — covering months of July, August and September — of the current financial year (2023-24 or FY24). India’s Gross Domestic Product — the measure of economic output — had grown by 7.6% in Q2.
(Credits- The Economic Times)
In other words, India’s real GDP (that is, after one takes away the effect of price inflation) in Q2 of FY24 is 7.6% more than what it was in the same three months of FY23.
What is the significance?
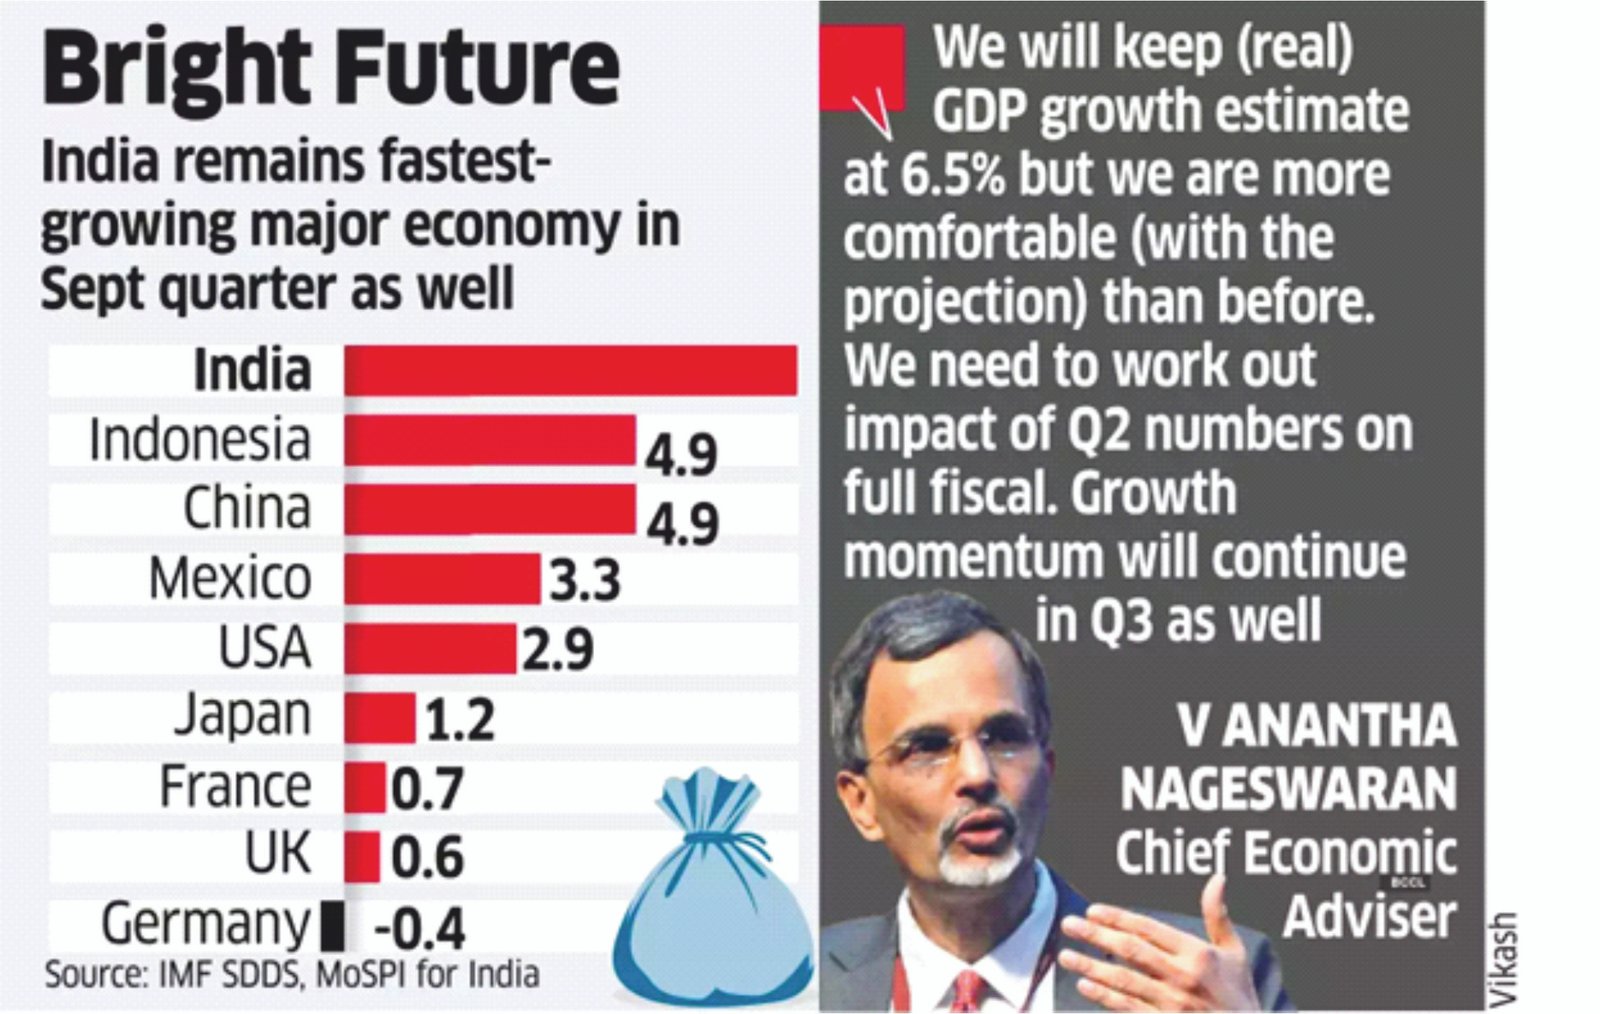
- This is welcome news because not only is this a fairly impressive level of economic growth, it also beats all market expectations. The first significance of the news is that it has triggered a flurry of upward revisions in the GDP forecast for the full financial year.
- Secondly, it seems to be vindicating the growth projections of India’s central bank. At the start of the financial year, the Reserve Bank of India looked like an outlier when it forecast a full-year GDP growth rate of 6.5% while most other professional economists had pegged it close to 6%; some even lower — as low as 5.5%.
- With most others now pushing up the FY24 projection to 6.5%, the RBI looks like it got its forecast spot on.
- Thirdly, this also means that RBI is unlikely to cut interest rates sooner than expected. Had the growth rate been below market expectations, the probability of a rate cut would have heightened.
- Lastly, it is noteworthy that it was exactly three years ago — when MoSPI announced the Q2 GDP data for 2020-21 — that India went into a technical recession. The upside surprise on growth has given hope that India’s economic recovery is now gathering momentum.
What to look at: GDP or GVA?
- There are two ways to calculate GDP.One is to look at how people spend their money — the expenditure side of the economy — and the other is to look at the income side of the economy. The former is called the GDP and the latter is mapped by looking at the Gross Value Added (GVA).
- According to the RBI, the GVA of a sector is defined as the value of output minus the value of its intermediary inputs. This “value added” is shared among the primary factors of production, labour and capital.
- One can get the GDP from the GVA route as well by adding the indirect taxes earned by the government and subtracting the subsidies provided by the government.
- The difference in the two ways to calculate GDP is called discrepancy and can sometimes become a major controversy, as it happened when the GDP data for the first quarter was released.
- Thanks to the availability of relevant data, the conventional wisdom is to look at GVA numbers more closely when making sense of quarterly trends of economic growth and to look at GDP (expenditure data) when analysing annual trends.
What does the GVA data show?
(Credits- Indian Express)
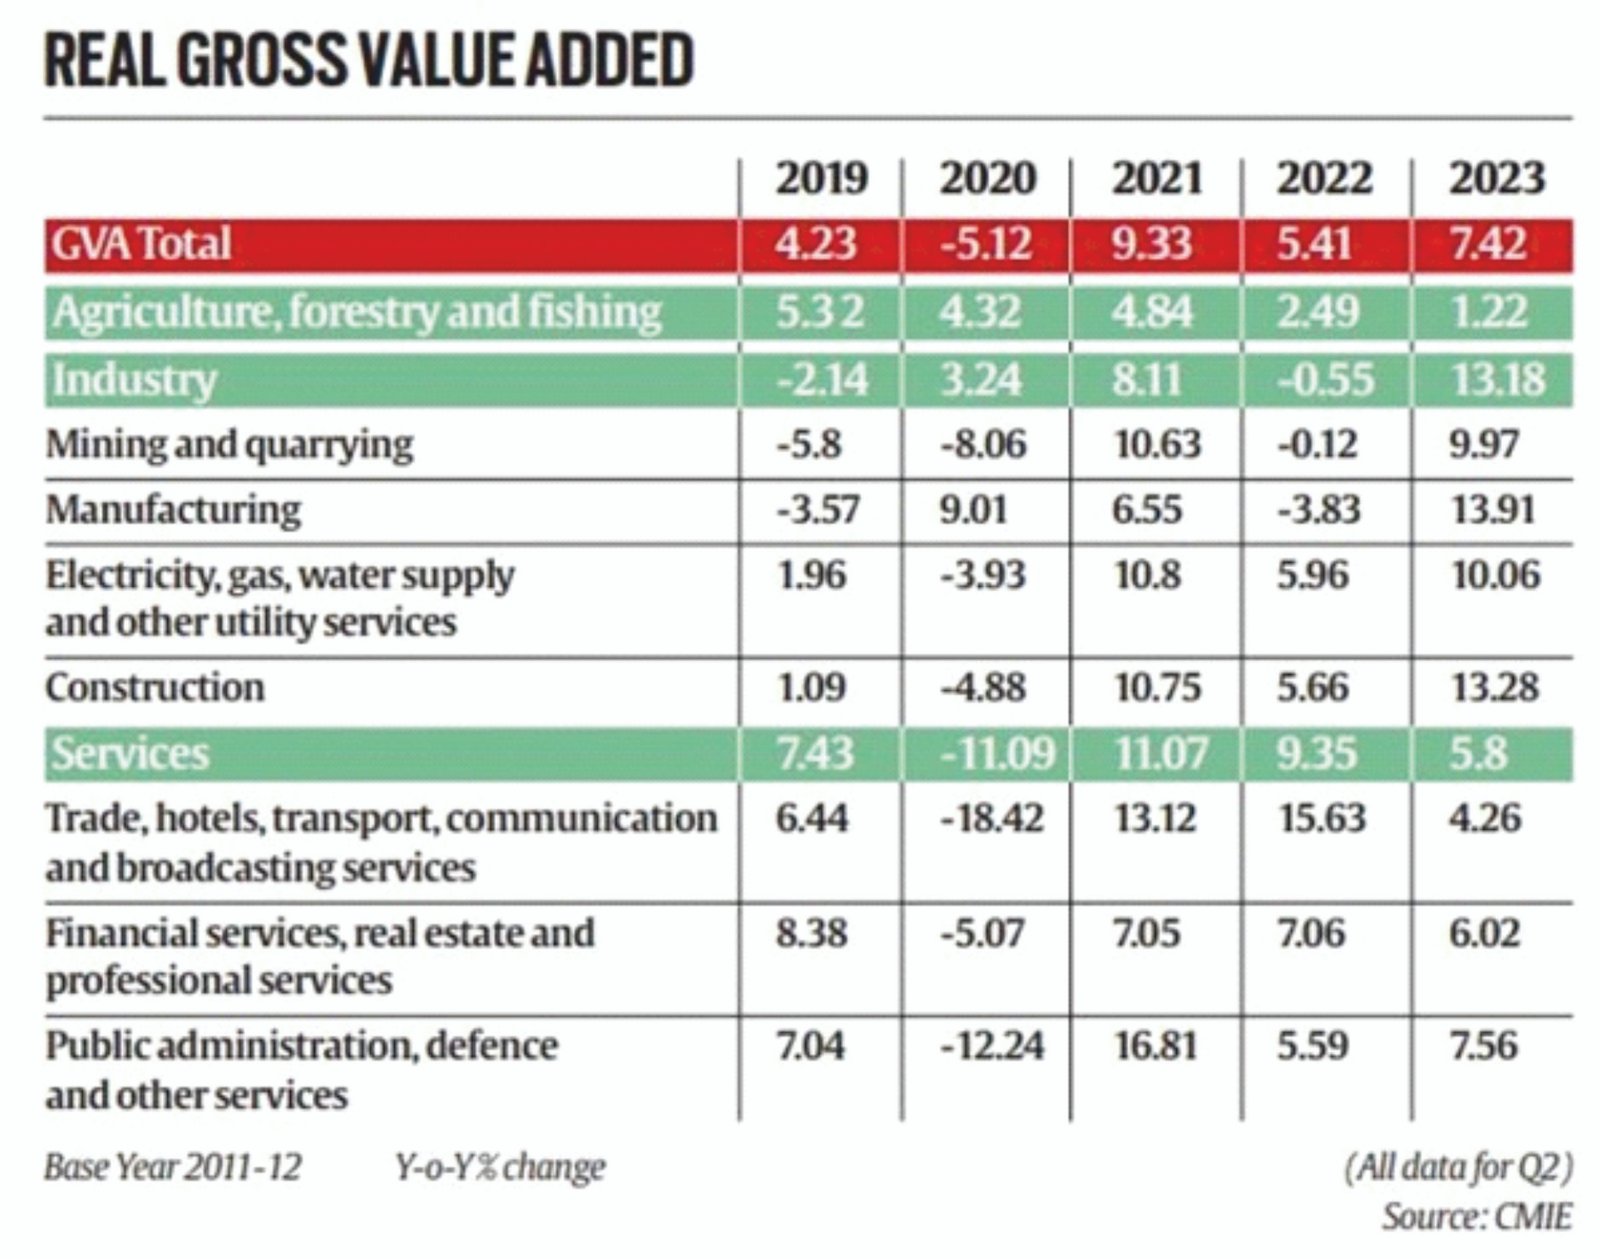
- The first thing to note is that the contribution of Agriculture and allied sectors has seen a steady decline. In the current Q2, agriculture grew by just 1.2% — a far cry from the 4.3% it grew in the year of the Covid pandemic, when the rest of the economy contracted. Last year, the same quarter saw 2.5% growth — half of the year before.
- This steady deceleration points to a likely increase in economic stress in rural India. Most experts expect farm production to not recover in the second half of the current financial year.
- The second noteworthy aspect is the spike in industrial GVA growth rate. It has grown by over 13%. In particular, manufacturing has grown by close to 14%. These spectacular growth numbers are reminiscent of the high growth phase that India witnessed between 2004 and 2008. However, it may be too early to claim that India’s manufacturing has completed a revival.
- For one, the latest growth rates for both industry and manufacturing benefit heavily from a fairly low base.
- Improved corporate performance was another reason apart from the low base effect for the overall industrial GVA surprise.
- As one looks at the third sector of the economy — services — the picture again turns. At a growth rate of 5.8%, the services economy has experienced a sharp deceleration over the same quarter last year.
- Data suggests that businesses involved in sub-sectors such as “trade, hotels, transport, communication and broadcasting services” grew by just over 4% — the kind of growth rate one associates with agriculture, which is typically the slowest-growing sector.
Conclusion- While the Q2 data was a pleasant surprise, few economists are convinced as yet to take this as conclusive evidence of a sustained momentum. Most economists expect growth to moderate a bit in the remaining two quarters, and possibly continue to moderate over FY25.
Syllabus- GS-3; Economy
Source- Indian Express