Satellites tracking the weather
Context:
- Large parts of North India, including Delhi, Bihar, Uttar Pradesh, Uttarakhand, Haryana, and Punjab have been wrapped with heavy fog since December 2023.
- Few days back the India Meteorological Department (IMD) warned of a high likelihood of “very dense fog” in Haryana, Chandigarh, and Delhi, where it noted that visibility would be lower than 50 metres in “night/morning hours”.
- It issued similar warnings for Uttar Pradesh, Punjab, and Madhya Pradesh, where it said visibility could be limited to 50200 metres.
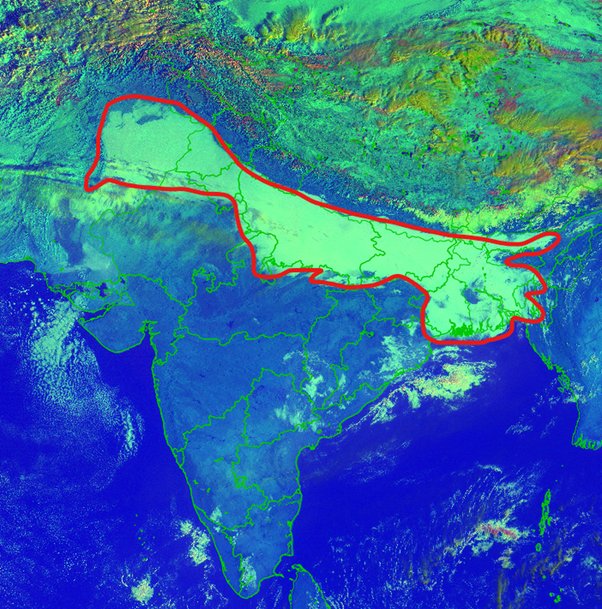
- On the social media platform X (formerly Twitter), the IMD has accompanied these alerts with maps from the INSAT 3D satellite, and also from the INSAT 3DR satellite.
- The fog in the shared maps is both clearly visible and annotated by the IMD.
How to read the weather maps and what do the colours represent?
- According to a paper published by IMD scientists in 2019, the INSAT 3D satellite has a redgreenblue, or RGB, imager whose images colours are determined by two factors including solar reflectance and brightness temperature.
- Solar reflectance refers to the ratio of the amount of solar energy reflected by a surface and the amount of solar energy incident on it.
- Brightness temperature is related to the relationship between the temperature of an object and the corresponding brightness of its surface.
- Brightness temperature also has to do with how the glass emits the thermal radiation, which is at different frequencies in different directions.
- The INSAT 3D’s ‘day microphysics’ data component studies solar reflectance at 3 wavelengths: 0.5 micrometres (visible radiation), 1.6 micrometres (shortwave infrared radiation) and 10.8 micrometres (thermal infrared radiation).
- The strength of the 0.5 micrometre visible signal determines the amount of green colour; the strength of the 1.6 micrometre shortwave infrared signal represents the amount of red colour; and the strength of the 10.8 micrometre thermal infrared signal determines the amount of blue colour.
- This way, the INSAT 3D computer determines the colour on each point of the image.
How do the satellites collect weather data?
- Both INSAT 3D and INSAT 3DR use radio meters to make their spectral measurements.
- A radiometre is a device that measures various useful properties of radiation generally by taking advantage of radiation’s interaction with matter.
- Both satellites also carry atmospheric sounders.
- These are devices which measure temperature and humidity, and study water vapour as a function of their heights from the ground.
- Scientists combine the radio meter and sounder measurements to understand various atmospheric characteristics.