SDG 11: MAKE CITIES INCLUSIVE, SAFE, RESILIENT & SUSTAINABLE

Goal 11 of the Sustainable Development Goals (SDGs) emphasizes the need for making cities and human settlements inclusive, safe, resilient, and sustainable.
As urban populations continue to rise, addressing the challenges of urbanization becomes crucial for global development.
GOALS & TARGETS
- Housing and Services: Ensure access to adequate, safe, and affordable housing and upgrade slums (Target 11.1).
- Transport Systems: Provide sustainable transport systems, focusing on vulnerable groups (Target 11.2).
- Urban Planning: Enhance sustainable urbanization and integrated planning (Target 11.3).
- Cultural Heritage: Protect cultural and natural heritage (Target 11.4).
- Disaster Risk Reduction: Reduce deaths and economic losses from disasters (Target 11.5).
- Environmental Impact: Address adverse environmental impacts, particularly air quality and waste management (Target 11.6).
- Public Spaces: Ensure access to safe, inclusive, and green public spaces (Target 11.7).
- Rural-Urban Linkages: Strengthen planning between urban and rural areas (Target 11.A).
- Integrated Policies: Increase cities adopting integrated policies for resilience and disaster risk management (Target 11.B).
- Support for Developing Countries: Assist least developed countries in building sustainable structures with local materials (Target 11.C).
KEY FACTS & FIGURES
- Population Growth: As of 2022, the global population reached 8 billion, with over 50% living in urban This figure is projected to rise to 70% by 2050.
- Slum Conditions: Approximately 1.1 billion people currently live in slums or slum-like conditions. An additional 2 billion are expected to join them in the next 30 years.
- Urbanization Challenges: In 2022, only half of the urban population had convenient access to public transport. Issues such as urban sprawl, air pollution, and limited public spaces persist.
- Disaster Risk Strategies: Since the implementation of the SDGs in 2015, the number of countries with national and local disaster risk reduction strategies has doubled.
- Environmental Impact: Cities occupy just 3% of the Earth’s land but account for 60-80% of energy consumption and 75% of carbon emissions.
- Geographic Concentration of Slum Dwellers: 85% of slum dwellers are concentrated in three regions:
- Central and Southern Asia (359 million),
- Eastern and South-Eastern Asia (306 million), and
- sub-Saharan Africa (230 million).
- Urban Growth Rate: From 2000 to 2010, global cities expanded physically faster than their population growth rates, with average annual land consumption rates of 2.0% compared to a population growth rate of 1.6%.
CURRENT URBAN CHALLENGES
- Rapid Urbanization: Many cities are unprepared for the rapid growth, leading to inadequate housing and services.
- Inequality and Poverty: Urban growth in smaller cities exacerbates social inequalities and urban poverty.
- Environmental Concerns: Pollution and urban sprawl contribute to health issues and deteriorate living conditions.
- Climate Vulnerability: High population density in urban areas increases susceptibility to climate change and natural disasters.
IMPORTANCE OF SUSTAINABLE URBAN DEVELOPMENT
- Quality of Life: Sustainable practices improve living conditions, reduce pollution, and enhance health.
- Economic Growth: Investments in infrastructure like public transport generate economic activity.
- Social Stability: Addressing inequalities fosters social cohesion and stability.
SDG 11 & INDIA

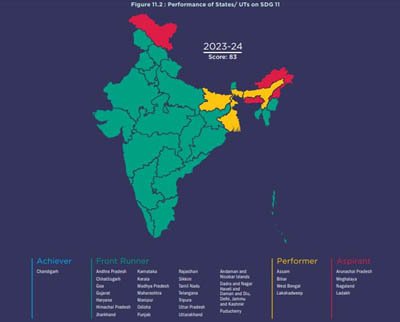
To assess India’s progress towards SDG 11, seven national indicators have been identified. These indicators facilitate data comparison across States and Union Territories (UTs).
INDIA’S PERFORMANCE

- State Scores: Ranges from 38 to 98.
- UT Scores: Ranges from 33 to 100.
- Top Performers: Maharashtra (States) and Chandigarh (UTs) lead the rankings.
- Categories: 22 States and 5 UTs are categorized as Front Runners (scores between 65 and 100), while 3 States and one UT are in the Aspirants category (scores below 50).
KEY INDICATORS & HIGHLIGHTS
- Urban Households in Kachha Houses:
- National Data: 0.9% live in Kachha houses (NFHS-5, 2019–2021).
- Top States: Kerala has zero households in Kachha houses, while Arunachal Pradesh has the highest at 10.4%.
- Individual Household Toilets:
- 2023 Achievement: 95.29% construction rate under SBM(U).
- Lowest Construction: Meghalaya (31.66%) and Delhi (15.50%).
- Door-to-Door Waste Collection:
- Current Coverage: 97% of wards with 100% collection as of 2024.
- Lowest Coverage: Nagaland at 49.76%.
- Road Accident Deaths:
- 2022 Statistics: Average of 13 deaths per 100,000
- Highest Rate: Himachal Pradesh (44), lowest in Nagaland (1).
- Achievement: Nine States have met the target to halve deaths from 2015 levels.
- Municipal Solid Waste Processing:
- 2023 Data: 78.46% of waste processed.
- Top Achievers: Chandigarh and Dadra and Nagar Haveli and Daman and Diu at 100%, while Puducherry lags at 7.71%.
- Source Segregation of Waste:
- 2023 Achievement: 90% of wards have source segregation.
- Lowest Rate: Nagaland at 31.43%; Andaman and Nicobar Islands, Chandigarh, Puducherry, and Dadra and Nagar Haveli and Daman and Diu achieve 100%.
- Sewage Treatment Capacity:
- Current Capacity: 50.67% of urban sewage can be treated (as of March 2021).
- Exceeding Capacity: Himachal Pradesh (133.62%), Maharashtra (107.82%), and Chandigarh (155.85%).
- No Treatment Capacity: States like Manipur, Arunachal Pradesh, and Nagaland lack sewage treatment facilities.
Note: Connect with Vajirao & Reddy Institute to keep yourself updated with latest UPSC Current Affairs in English.
Note: We upload Current Affairs Except Sunday.

